
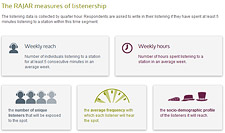
The RAJAR measures of listenership
RAJAR measures for each station on the survey how many people listen to the station in an average week and how long they spend listening.
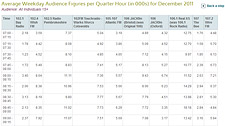
The listening data is collected by quarter hour. Respondents are asked to write in their listening if they have spent at least 5 minutes listening to a station within this time segment.
Weekly reach
Number of individuals listening to a station for at least 5 consecutive minutes in an average week.
Weekly hours
Number of hours spent listening to a station in an average week.
The share for a station is calculated as its number of hours divided by the total All Radio hours in the station’s TSA. When the data is then used on a planning system to buy airtime, it allows an advertiser to estimate:
the number of unique listeners that will be exposed to the spot.
the average frequency with which each listener will hear the spot.
the socio-demographic profile of the listeners it will reach.
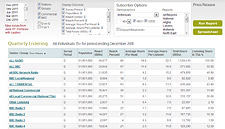
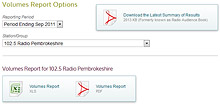
Each station is reported on a 3, 6 or 12 month sample, depending on its size. This is denoted by the letters Q, H or Y on the press release.
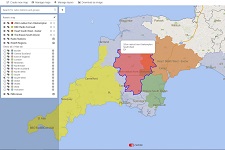
Each station is reported on its TSA, which size can range between 50,000 for the smallest station currently on the survey, to 55m adults for a National service.
Both geography and reporting period have to be taken into account when drawing comparisons between stations. For full details of what can be published, please check the RAJAR Publication Code.