Press Contact
If you would like to get in touch with the press team, please call Anne Robshaw on 020 7395 0630.

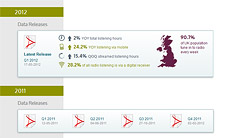
2026
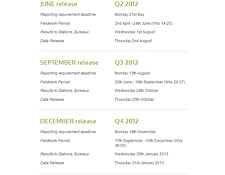
Data Releases
27% of adults listen to radio via a mobile phone or tablet
Listening online reaches 306 million hours
Digital Share now stands at 77%
67% claim to own a DAB radio
`
 On average
87%
of the UK population tune in to radio each week
On average
87%
of the UK population tune in to radio each week
On average
87%
of the UK population tune in to radio each week
MIDAS
2025
Audio Time
Data Releases
28% of adults listen to radio via a mobile phone or tablet
Listening online reaches 302 million hours
Digital Share now stands at 75%
67% claim to own a DAB radio
`
On average
86%
of the UK population tune in to radio each week
On average
86%
of the UK population tune in to radio each week