

News -
General
Introduction to the New RAJAR Contract
Issued: August 06 2007
1. Introduction to the New RAJAR Contract
The new RAJAR contract will see data published for the first time in August with the release of the RAJAR Quarter 2 data. While the new contract encompasses some significant improvements, the underlying methodology remains the same and we have preserved compatibility with the old contract wherever possible. However, it has been necessary to introduce some changes to facilitate the enhancements that the industry requested.
2. Comparing New Contract Data with Old
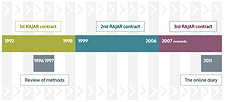
Unlike the change in contract that occurred in 1999, it will be possible to make direct comparisons between Q2, 2007 and previous periods. However, data users should bear in mind that there have been changes to the majority of populations caused by changes to Total Survey Area (TSA) boundaries, and some apparent increases or decreases in audience may be due, at least in part, to changes in the published population.
When making comparisons between data pre and post Q2 2007, please use the following note:
New RAJAR specification introduced in Q2 2007. Please use caution when comparing data across this period.
3. Key Changes
The key changes are:
- Brand new radio map
- New diary incorporating platform
- New processing and reporting software
- Inclusion of out-of-area listening (for internal use)
- More detailed reports
- Faster turnaround
This document outlines the new features that affect the survey.
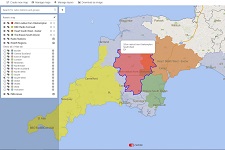
4.1 The New Radio Map
All local and regional stations have redrawn their Total Survey Areas (TSAs) based upon Postcode Districts. Under the previous system, stations based their survey areas on Postcode Sectors. In principle this was a good idea as it allowed great flexibility in drawing the boundaries of a TSA; however, over time it generated a large number of very small segments, each of which required diaries to be placed in order for the population of those areas to be included in the results. Small segments required a disproportionate share of the available diaries, resulting in reduced sample efficiency. Furthermore, small segments deliver small samples which restrict the level of sample balancing that can be applied, in turn promoting high weights leading to instability in the data.
Moving to postcode districts has not only condensed the number of small segments, it has also increased the average population size in the small segments that remain, thus producing a much more efficient sample. Larger average segments also leads to better sample control, allowing populations to be balanced across as many demographic dimensions as possible.
Both of these improvements should lead increased sample reliability and, in turn, more robust data.
4.2 How the New Map Affects Reporting
One important aspect of changing TSA boundaries is to determine when the new TSAs begin to report. Normally when a station changes its TSA there can be no reporting on the new TSA until the appropriate amount of data has been collected. Since the new TSAs were only finalised in the latter part of 2006, this would have meant that 12-monthly stations could not report on their new TSAs until Q4 of 2007. To counter this, RAJAR decided to list all 12-monthly stations outside of their TSAs during Q3 and Q4 of 2006 so that when TSA changes were made, and provided those changes were of anticipated dimensions, there would be back-data available to report on.
Obviously, not all TSA changes were anticipated - some stations used the opportunity to radically alter their TSA boundaries - but in the majority of cases RAJAR’s Q3 and Q4 coverage was more than adequate. Where stations undertook major TSA surgery, there may be some shortfalls in the reporting sample because the fieldwork operation was unable to anticipate the new TSAs. However, it is highly unlikely that any of the shortfalls will have a significant effect on results.
4.3 Out-of-Area Listening
Under the new contract, any listening to a station outside of its reported TSA will be credited to the station and will not be recoded to the appropriate "Other" category. Provided a station has access to an appropriate bureau planning system, it will be possible to analyse its out-of-area listening in adjacent TSAs, or across the country. However, the survey is not designed to be a definitive measurement of out-of-area performance. For this reason, out-of-area information is intended for internal purposes only and cannot be traded upon.
5. The New Diary
The diary is still the preferred means of measuring radio audiences worldwide. The RAJAR diary remains the same as before with one notable exception - 4 new columns have been added to every page to allow respondents to record whether they listened via analogue or digital means. They can choose between 4 platforms in total - AM/FM, DAB, DTV or Internet. This version of the diary was successfully tested at the end of 2006 and although not everyone was able to determine platform on every occasion, the majority of listening occasions were credited to a particular platform.
Platform capture went live in the diary from January 1st 2007. Consequently, quarterly and half-yearly stations will have platform data potentially available from their full samples from Quarter 2, 2007 onwards. Yearly stations will have access to platform data for 6 out of the 12 months in Q2, 9 out of 12 months in Q3 and the full 12 months in Q4.
6. Weighting/Processing Software
Completely new software has been developed to manage the raw data and produce tabulated reports, and is expected to streamline the production and checking process and reduce the opportunity for errors. Furthermore, the improved sample design described above will facilitate the implementation of a more detailed weighting scheme to balance the reporting sample in more detail than ever before.
7. Reporting
The biggest changes to reporting affect the Commercial Radio Reports.
7.1 Standard Volumes (formerly Tables 1-9)
These will be available in hard copy as usual to subscribing stations. They will also be available electronically in the Subscribers section of the RAJAR website.
These tables will adopt a revised table numbering, as follows:
| Table 0 | Cumulative Weekly Audience Quarter on Quarter |
|---|---|
| Table 1 | Cumulative Weekly Audience (38 demographics) |
| Table 2 | Share by Segments (20 demographics) |
| Table 3 | Reach by Segments (20 demographics) |
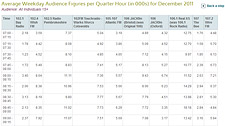
| Table 4 | Audience by Half-Hour - Weekday Average (20 demographics) |
| Table 5 | Audience by Half-Hour - Saturday (20 demographics) |
| Table 6 | Audience by Half-Hour - Sunday (20 demographics) |
| Table 7 | Cumulative Weekly Audience (by competitor services) |
| Table 8 | Share by Segments (by competitor services) |
| Table 9 | Reach by Segments (by competitor services) |
| Table 10 | Predicted Cumulative Audiences (20 demographics) |
7.2 Standard Volumes - Electronic Files
These tables are electronic versions of the Standard Tables and will be available from the RAJAR secure FTP server. They will be identical to the hard copy volumes with one exception - where demographic categories are used as column headings, a total of 90 categories will be available.
7.3 The Radio Audience - Volumes 1 & 2
The hardcopy 2-Volume Bound Reports will no longer be available
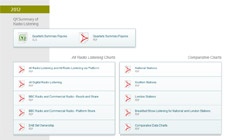
7.4 The Radio Audience - Summary of Results
This will be available as before, using the same 20 demographic categories.
7.5 Radio Analysis Book
This will no longer be available.
Please note the above is for information purposes only and is not subject to debate. All decisions on reporting were taken by the shareholding parties following internal consultation. This process resulted in the development of the RAJAR specification, with RAJAR acting upon the subsequent instructions.
7.6 Reporting Data by Platform
Platform data will not be published directly by RAJAR (although some top-line All-Radio platform data will be made available on the RAJAR website). Stations will be able to access platform data through electronic planning systems via a bureau. The decision on whether to publish (or trade) data by platform will rest with individual stations who will be free to publish their own platform figures. It should be noted that stations may only publish their own platform data - they may NOT publish platform-based data for any competitor services.
There are 6 Platform status codes:
- AM/FM (i.e. analogue)
- DAB
- DTV (i.e. Sky, Freeview, Cable)
- Internet
- Analogue/Digital Unspecified (i.e. the respondent did not record which platform for a station that is available both on analogue and via digital)
- Digital unspecified (i.e. the respondent did not record which platform for a station that is only available via digital)
It is inevitable that there will be a certain amount of listening via an unspecified platform - it is not always possible for respondents to know which platform they are listening on. However, every effort is being made by RAJAR to ensure that the instructions given to both interviewers and respondents will elicit the highest possible volume of specified platforms.
7.7 Reporting Schedule
Stations will have access to their own data as usual at 17.30 on the Wednesday of release. At 18.30, Commercial stations will be able to access data for all other Commercial stations. A strict embargo will be in place until 7am on the following Thursday morning. Action will be taken against any organisation or individual found to be in breach of this embargo.
7.8 Faster Reporting
The first data release incorporates a double verification check whereby the data is processed separately using two independent systems. Future data releases will not have to undergo this additional safety check and will be earlier as a result. Furthermore, RAJAR has taken steps to streamline the supporting files and release these earlier to the bureaux planning systems which may result in the gap between data release and trading being reduced. Any time savings will be reflected in future schedules, however, while every effort will be made by RAJAR to deliver to the tightest possible schedule, we will not compromise the validity of the data, which will always take priority.