
Frequently Asked Questions
How do you carry out your survey?
Can I find out the audience for a specific station?
Can you tell me how many people listen to a specific programme?
The BBC can be contacted via their website www.bbc.co.uk/contact#radio
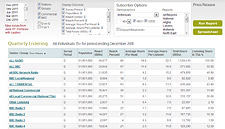
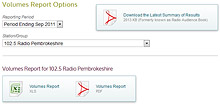
Can RAJAR run me a data report?
Can you provide information on station formats?
How far back in time do you have data for?
Why can't I get into ranker, trends or maps?
How do I become a subscriber?
Can you tell me how many people listen to radio via the Internet?
Why are the figures not available free? E.g. in my library.
How can I join your survey panel?
Do you have data for TV viewing?
Can you give me listening/viewing figures for the whole of Europe?
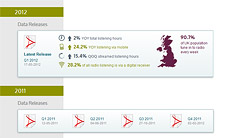
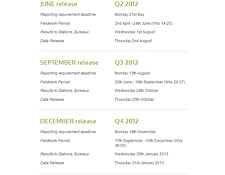
When is the next data release?
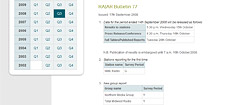
When does the next sweep start/finish?
I am a subscriber and I cannot find my password/ have lost my password.
Do you measure hospital and student radio stations?
Do you measure community radio stations?
Can a charitable not for profit station get a discount on fees to join the survey?
How many diaries are placed in Overlap areas?
Do I get less good ratings because there are more diaries in the outskirts of my TSA rather than the core?
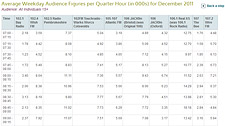
Stations often get more diaries in their outskirts because that's where the most overlaps occur i.e. other stations have their own diary requirements and if they need more diaries in a smaller area, then they will inflate the proportion of diaries in the overlap area. However, because RAJAR treats each overlap area as a separate survey segment, the diaries in each area are weighted back to the correct proportion. For example, Andrews FM is a station of 1m TSA, with an overlap with Cloudy FM (TSA 300,000), where the population in the overlap area is 200,000. Andrews FM needs 600 diaries overall, but Cloudy FM needs 500. Thus Andrews FM only needs 120 diaries in the overlap area (20% of 600) but Cloudy FM needs 366 (66% of 500). This means that, on paper, Andrews FM has 846 diaries (480 in the non-overlap area and 366 in the overlap area). However, those 366 diaries are down weighted so that they only represent 20% of Andrews FM's results. Effectively, people living in the non-overlap area are worth more per head than people living in the overlap area. (Non-overlap = 480 people representing 800,000 = 1 person is weighted up to 1,667; Overlap = 366 people representing 200,000 = 1 person is weighted up to 546.)....and even if the weighting deals with it, doesn't it mean that we are weighting results that are skewed against me to start with?
As above - the weighting means that the results that are "skewed" make a lesser contribution to your overall results than the "un-skewed".....and how do I know we are getting a balanced set of postcodes in the core?
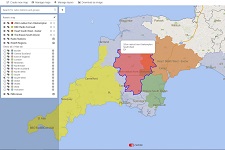
We go to great pains to map out each segment so that sample points are distributed equitably in terms of distance and direction from the center, as well as balancing the sample points in terms of type of residence, ethnicity, social grade of area etc. to ensure we represent the area fairly.What happens if a group of postcodes with low listening are picked which are not representative of my audience?
The selection is random outside the above controls and although we weight everyone to balance the normal things (working status, household size, age, gender etc) it is a random sample and we cannot balance in terms of how much they listen or to what. Sometimes the sample for a quarter works out a bit more favorably, other times less favorably, but over time the results give a true representation of the station's health. This is called "sample error" and is a fact of life in survey research. Think of it like tossing a coin ten times. You should get 5 heads and 5 tails each time, but often you'll get 6 of one and 4 of the other, or even worse. But the more times you toss the coin, the more likely you are to get a correct result.**Please note we boost core London by 500 diaries per quarter.
Student Enquiries
Individual student enquiries
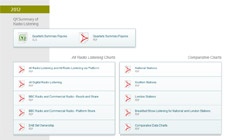
For any Student enquiries please email anne@rajar.co.uk, a Student Pack can be provided on request. This includes trend analysis; All Radio Listening Charts, Comparative Data Charts and Volumes Tables (including a breakdown by demographic) . Unfortunately, we cannot provide Programme specific data nor in depth information to anyone who is not a Subscriber to RAJAR.
Requests for interviews
Unfortunately we are unable to give interviews or opinions on the radio industry or the stations broadcasting.
Academic Institutions
RAJAR welcomes interest from the academic world and frequently supports Universities and centres of learning with relevant media courses, and where requests are based on helping multiple students. We will respond to requests made by department heads on a discretionary basis, subject to resources.