
Subscriber Content
The Subscribers Only functionality is available to RAJAR subscribers who have paid for website access to the RAJAR data. You will require a valid username and password to access this area but you'll only need to enter it the first time you visit (and when you change pc/browser).
For subscription rates please check the How to Subscribe area.
Access across the site is governed as follows:
Open Access
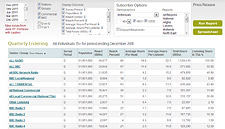
Quarterly Listening
-
Quarter
See data going back to March 1999. -
Stations / Groups, Commercial / BBC
Displays results for Groups only, Stations only, or both, for Commercial, BBC or both. -
Q on Q or Y on Y
Displays up to 4 consecutive quarters or year on year results, as well as calculate Q on Q and Y on Y change in percent. -
Display Columns
Survey Period
Population (000s)
Reach (000s)
Reach%
Average Hours per Head
Average Hours per Listener
Total Hours (000s)
Quarterly Listening
-
Display Columns
Population profile
Reach index
Hours index
Cost Efficiency Factor -
Demographics
The following audiences are available for individual stations from Q3 2004:
There are limited demographics for data prior to Q3 2004 and for groupings such as All Radio, All Commercial and All BBC prior to Q2 2007.Individuals: All / Male / Female / Main Shoppers / Main Shoppers with children Age breaks: 10+, 10-14, 10-24, 10-34, 10-44, 10-54, 10-64, 10-74
15+, 15-24, 15-34, 15-44, 15-54, 15-64, 15-74
18+, 18-34, 18-44, 18-54, 18-64, 18-74
25+, 25-34, 25-44, 25-54, 25-64, 25-74
35+, 35-44, 35-54, 35-64, 35-74
45+, 45-54, 45-64, 45-74
55+, 55-64, 55-74
65+, 65-74
75+Social Grade: All / ABC1 / C2DE (42 x 5 x 3 = 630 audience categories) -
Regions
This option allows you to organise stations by RAJAR regions. Note that station results will be based on their published TSA and not necessarily on the region’s population. -
Daypart Breakdown
This option allows you to display Average Audience by Daypart (Breakfast Peak, Mid Morning, Afternoon, PM Drive, Evening, Overnight, see Glossary for full details).
About RAJAR - The Process
An online resource giving very detailed information about how the survey is conducted.
Subscriber Only
The RAJAR Website user manual is provided to allow the user to gain greater insight into what is included in the Subscriber section. A full glossary of terms is provided and instructions are given on how to filter the data and maximise the potential of the RAJAR website.
Audiences by daypart
Available when you click on a station name in the Quarterly Listening page. For each station, displays Average Audience with dayparts as columns and demographics as rows.
Audiences by period
Available when you click on a station name in the Quarterly Listening page.
For each station, choose your columns from the Display Columns box (Population, Reach, Hours etc...) and see results broken down by demographics.
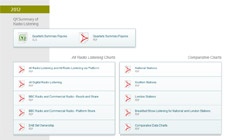
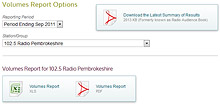
Volumes
These are standard tables showing results in a pre-formatted way for each participating Commercial Radio station or group, as well as the BBC Networks.
From Q2 2007, tables made available on the website are:
- Table 0: Trends data (All Adults)
- Table 1: Cumulative weekly audience (reach), total and average hours, by demographics
- Table 2: Share by day part segment
- Table 3: Reach by day part segment
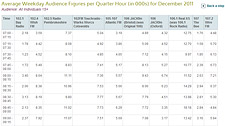
- Table 4: Average half hour audience - Monday-Friday (averaged)
- Table 5: Average half hour audience - Saturday
- Table 6: Average half hour audience - Sunday
- Table 7: Cumulative weekly audience (reach), total and average hours, by competitive stations
- Table 8: Share by day part segment, by competitive stations
- Table 9: Reach by day part segment, by competitive stations
- Table 10: Predicted cumulative audiences (on 1, 2, 3, 4, 8 and 13 weeks)
Prior to Q2, the tables available are 1, 4, 5, 6, 7 and 10 only.
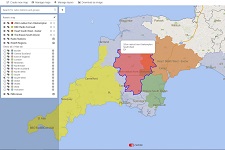
Mapping
This option allows you to display Total Survey Area for any station on the survey. Unlimited stations can be displayed on the same map, alongside RAJAR regions & ISBA reporting areas.
Quarter Hour Chart
This analysis allows you to select published groups or individual stations and displays average audience for each quarter hour for any of the previously mentioned demographic groups.